In my professional learning session, K-8 Science and Engineering Everyday? Yes! Hooray!, one of the strategies I share with teachers to add more scientific thinking to their daily schedules is to use phenomena as bellringers. Reclaiming those first 10-15 minutes of the day when kids are unpacking and settling in is an easy solution to a limited amount of science instructional time. You are also setting the tone for the day – students in your class are expected to notice, wonder, think deeply, and come to discussions prepared to contribute. (Plus, you have the added benefits of reducing classroom disruptions because the students are engaged in an activity!)
During the session, I share photo and video examples of phenomena. Teachers experience constructing a notice and wonder chart, and I demonstrate how to use talk moves to facilitate classroom discussion. I always mention Iowa Science Pheonomena developed by Iowa PBS. It is a fantastic repository of phenomena.
I also talk about using data as phenomena. It often isn’t as popular among us elementary teachers, yet we live in a data-driven society. Students need to develop the ability to analyze and interpret a variety of data sets. In fact one 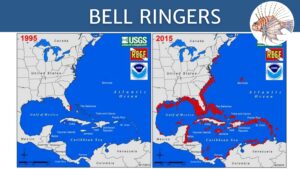 of the science and engineering practices in the Next Generation Science Standards speaks specifically to that skill: Analyzing and Interpreting Data.
I share this map representation of data (to the right) in my presentation. The map shows the population of lionfish off the coast of Florida and in the Caribbean with twenty years separating the data sets. Students can be prompted with the following questions: What is this data showing? What questions do you have about this data? What additional information would help you to identify causes for this data? Who would use this data? Why?
After this experience, the next logical question from educators is: Where do I find data sets appropriate for elementary students? I wait in excited anticipation for that question! It thrills me to hear it every time because, as a former stressed-out fourth grade teacher, I love nothing more than to provide teachers with resources that will save them time. And when it comes to data sets, I’ve discovered a goldmine!
Resource #1 – Picture Books by Steve Jenkins
Steve Jenkins is probably best known for his amazing paper collage illustrations. He is a science picture book juggernaut and one of my personal favorite authors. (I actually cried when he passed away suddenly in 2021.) Jenkin’s series of “By The Numbers” books provide an entire school year’s worth of data for your students to interpret. Charts, graphs, maps, and infographics abound in such variety that your students can’t possibly be bored by his data. 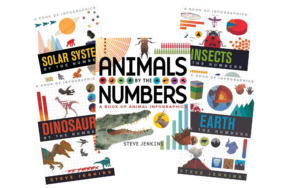
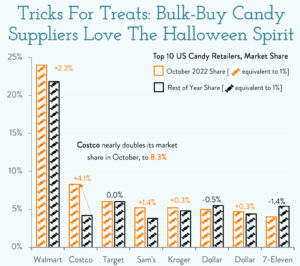 Resource #2 – Chartr
This website has a treasure trove of interesting and recent data that can be sent to your inbox four times a week. While not all of the content is appropriate for an elementary audience because of its subject matter, there is plenty of kid-friendly data to make subscribing worth “one more email” in your Inbox. A recent newsletter shared a bar graph (shown to the right) detailing the major retailers’ shares of candy sales in October compared to the rest of the year. You can view and search past newsletters HERE.
Do you have other data sources to share? Want to tell me how you used these data sources in your classroom? I’d love to hear form you! Send me an email using the Contact Us button at the bottom of this website.
 You can learn more about the professional learning sessions I offer HERE.
And you can visit our website: www.starrmatica.com to learn about the other ways I help elementary teachers to become rock star science educators!
Pssst! While you are there, be sure to check out our new cross-curricular connections kit!